NIWAs use of Hydro2de
Introduction
The National Institute of Water and Atmospheric Research (NIWA) in New
Zealand has been using Hydro2de for the last 10 years. After trialling
it on of a wide range of gravel-bedded braided river reaches (mean flows
of 3.4 to 100 m3/s) and a large sinuous single thread river (mean flow
291 m3/s), NIWA found Hydro2de to be robust software giving good results.
NIWA has since used Hydro2de to predict depths and velocities for a wide
range of flows in braided gravel-bed rivers. Much of his work was to predict
changes in physical habitat using instream flow incremental flow (IFIM)
principles for a wide range of species and life stages from benthic invertebrates
to salmonid species and including the feeding habitat of riverbed nesting
birds. NIWA has also used Hydro-2de to predict flood plain inundation on
the river with the highest peak flood flows in New Zealand (Buller River
- peak flow 12,500 m3/s). Currently (austral winter 2005) NIWA is carrying
out a flood plain inundation study on the largest river in New Zealand
(Clutha River mean flow 614 m3/s).
Digital elevation models (DEM)
Two-dimensional hydrodynamic models such as Hydro2de require a DEM of the
domain to be modelled. NIWA has used the following techniques to obtain
data on which to base a DEM:
· Traversing the domain on a grid pattern using a real time
kinematic global positioning system (RTK GPS)
· Digital photogrammetry
· Airborne laser survey (ALS)
None of these techniques provide data in deep wet channels. For wet
channels NIWA has used RTK GPS located echo-soundings from boats and relationships
between multi-spectral ortho-photography and RTK GPS located echo-soundings
to predict water depths that are then subtracted from water surface levels
to provide the bathymetry of the channel.
Hydraulic resistance estimation
Hydraulic resistance estimates for early models were primarily been based
on measured flows and modelled water surface slopes using the slope area
method. The resulting flow resistance was then applied universally to the
riverbed. For flood plain models two approaches have been used. The first
involves classification of the flood plain vegetation and land cover types
and applying appropriate values from the literature. In the Buller River
flood plain case the hydraulic resistance in the active channel was based
on measured grain sizes. The second approach involves analysis of remotely
sensed data to classify the ground cover and applying appropriate values
from the literature to different classes.
Modelling results
Figure 1 shows a photograph of a reach of the Hurunui River, New Zealand,
and modelled depths for the flow on the day of photography. The modelled
braiding pattern faithfully reproduces the pattern evident in the photograph.
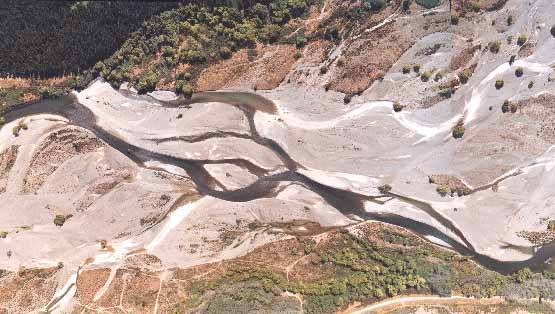
Figure 1: Comparison of photographed and modelled braiding patterns.
Flow is from left to right. Flow in the photograph and model is 12.7 m3/s.
Figure 2 shows a comparison between measured and modelled depths and
velocities for the Hurunui River where the model cell size was 1 m2. The
depths and velocities from a runs with a range of inflows was used to predict
the changes in instream habitat with flows changes for a number species
and life stages, as well the suitability of various flows for different
types of recreational boating (jet-boats and canoes), to help set minimum
monthly flows for the river.
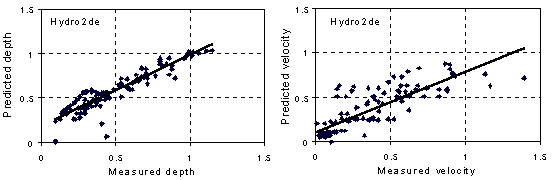
Figure 2. Depths and velocities measured by stream gauging plotted
against modelled velocities and depths.
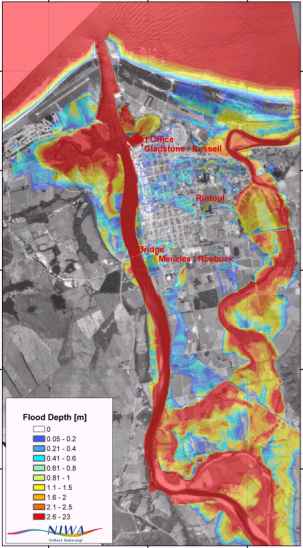
The model of the Buller River flood plain had a domain 12.5 km by 6.1
km and was modelled using a 7 m square grid that include the town of Westport.
The model was calibrated against flood levels from a 2% annual exceedance
probability (AEP) flood. As shown in Figure 3 Westport is located between
the Buller River on the left and the estuary on the right and is vulnerable
to flooding from either direction. The channel for normal flows is to the
bottom and the left of Figure 3 and is shown in dark red colours. During
large floods water spills down and old and usually dry channel to the right
of the figure where it flows into an estuary. Flooding in the town and
flood plain is complicated by the influence of tides and storm surge that
may be as large as 0.6 m in a 2% AEP storm surge event. A large number
of model runs were required to establish the AEP of floods in the town.
The full domain for 1% AEP inundation event in Westport is shown in Figure
3. Figure 4 shows flood depths for that event in Westport. The peak river
flood discharge for the event was 9400 m3/s. In this modelled event 28.2%
and 18.4 % of the town was flooded to depths of >0.05 m and >0.2 m respectively.
The model was used to explore mitigation options against the 1% inundation
event. A series of low flood banks around the perimeter of the town was
able to prevent flooding for a 1% AEP flooding event.
 |
 |
| Figure 3: The Buller River flood plain model domain showing the
course of flood waters for a 1% AEP inundation event in Westport. |
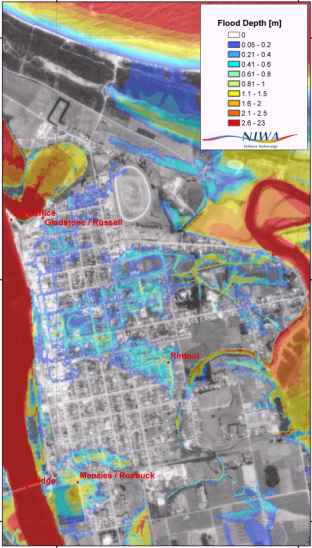
Figure 4: Westport showing an example of flooding for a 1% AEP inundation
event. The river flood and sea level peaks used in this simulation were
9400 m3/s and 1.35 m. 18.4% of Westport is flooded with water to a depth
of more than 0.2 m in this example. 28.2% of Westport is flooded with water
to a depth of more than 0.05 m. |
Conclusion
Hydro2de has proven to be an easy to use and robust model. It has served
NIWA well in providing modelled depths and velocities for IFIM type instream
physical habitat modelling and for flood inundation modelling.
Courtesy NIWA,
05-2005
Back
¦ Home